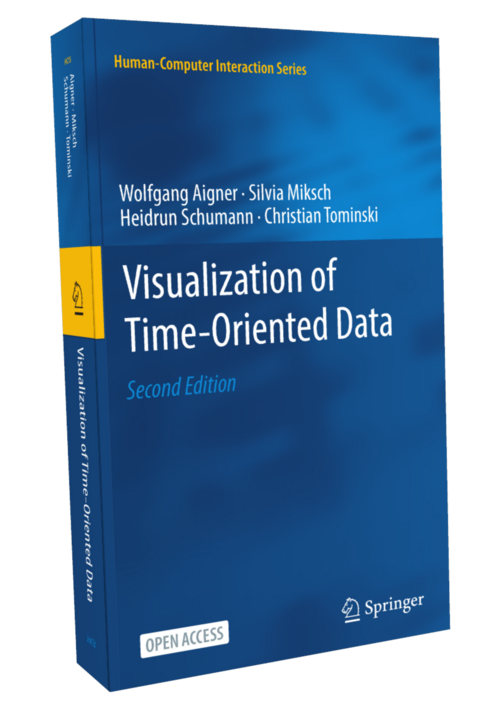
Time-oriented data are everywhere. They allow us to observe complex dynamic systems, learn from the past, and predict the future. But how can time-oriented data be visualized to make them easier to understand?
The book "Visualization of Time-Oriented Data" answers exactly this question. The book's second edition is now available. It was co-authored by Christian Tominski from the Institute of Visual and Analytic Computing, Heidrun Schumann, former head of the chair of Computer Graphics, and Silvia Miksch and Wolfgang Aigner, colleagues from the TU Wien and the FH St. Pölten in Austria.
The second edition builds on the great success of the first edition, which received over 1000 citations. At its core, the book develops a systematic view of the visualization of time-oriented data and discusses interaction techniques and computational methods to support the visual data analysis. About 50% new content has been added to the second edition. Best of all, the second edition is now published as an open access book, so that anyone interested can read it. The open access was made possible by the joint efforts of the Chair of Visual Analytics and the Austrian partner institutions.
For the second edition, the TimeViz Browser, the digital companion to the book's survey of visualization techniques, has also received a major upgrade. It includes more than 150 visualization techniques and offers additional filtering and search capabilities to help scientists and practitioners find suitable solutions for their needs.
More information is available at https://timeviz.net.
Second edition of the book "Visualization of Time-Oriented Data" now available
Back

